
Consumercarts is reader-supported. Learn more
AMD Ryzen 7 2700X vs Intel Core i5-14600K: Comparison
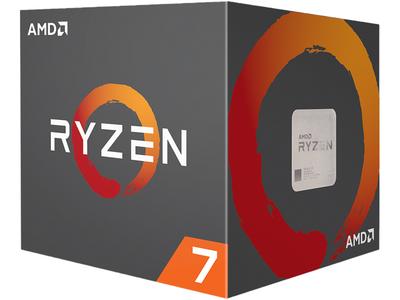
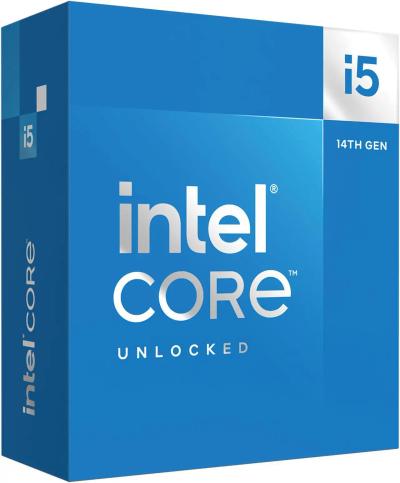
AMD Ryzen 7 2700X and Intel Core i5-14600K separate most on l2 cache: AMD Ryzen 7 2700X at 4 MB, Intel Core i5-14600K at 20 MB, 80% in favour of Intel Core i5-14600K. L3 Cache splits them by another 33%, again favouring Intel Core i5-14600K. They match on 7 other specifications, including form factor, market segment and socket status. In Blender Cycles (CPU) the Intel Core i5-14600K scores 300 against 144 for the AMD Ryzen 7 2700X, a lead of 52%.
Specs
| Specification |  |  |
|---|---|---|
| Brand | AMD | Intel |
| Product Line | Ryzen 7 | Core i |
| Form Factor | Desktop | Desktop |
| Model Number | 2700X | 14600K |
| Codename | Pinnacle Ridge | Raptor Lake Refresh |
| Core/Thread Count | 8 Core / 16 Thread | 14 Core (6P+8E) / 20 Thread |
| Release Year | 2018 | 2023 |
| TDP | 105 W | 125W Base / 181W Max Turbo |
| Market Segment | Desktop | Desktop |
| Cache | 16MB L3 + 4MB L2 + 768KB L1 | 24MB L3 + 20MB L2 |
| Socket | AM4 | LGA 1700 |
| Boost/Base Clock | 4.3 GHz / 3.7 GHz | 5.3 GHz / 3.5 GHz |
| Socket Status | End of Life | End of Life |
| Process Node | 12 nm | 10 nm |
| Performance Cores | 8 | 6 |
| Efficiency Cores | 0 | 8 |
| SMT Enabled | true | true |
| P-Core Base Clock | 3.7 GHz | 3.5 |
| P-Core Boost Clock | 4.3 GHz | 5.3 |
| L2 Cache | 4 MB-80% | 20 MB |
| L3 Cache | 16 MB-33% | 24 MB |
| Base Power | 105 W | 125 W |
| Max Turbo Power | 105 W | 181 |
| Memory Type | DDR4 | DDR5 or DDR4 |
| Max Memory Speed | 2933 MT/s | 5600 |
| Memory Channels | 2 | 2 |
| ECC Support | false | true |
| Integrated Graphics | No | Yes |
| Copilot Plus Certified | false | false |
| PCIe Generation | 3.0 | PCIe 5.0 |
| PCIe Lanes | 20 | 20 |
| Launch MSRP | $329 | 319 |
| Retail Availability | Retail | Boxed Retail |
| Series | Ryzen 7 | Core i5 |
| CPU Process Node | 12 Nanometers | Intel 7 |
| Architecture | Zen+, Ryzen 2000 Series | Raptor Lake Refresh, 14th Gen Intel Core |
Benchmarks
Measured results, not specifications. Percentages are the gap to the leading product in each test.
Blender Cycles (CPU)
Blender 4.5, Blender Open Data (CC0). Median of monster + junkshop + classroom, combined samples/min.
Blender renders 3D scenes by tracing light through them, which loads every core at once. The score measures sustained multi-core throughput, so a chip that wins here can still lose at gaming, where one or two fast cores matter more. Figures come from Blender's Open Data project, which places no restriction on reuse, and we publish the median of every submission for that chip on the same Blender version.